Chapter 2 Introduction to R
LEARNING OUTCOMES
- Identify the capabilities of R and RStudio's environment and appraise their functionality.
- Distinguish between R functions, objects, and diverse data wrangling approaches.
- Apply basic programming skills to import and organize the data using classic data wrangling approaches and the tidyverse grammar.
- Evaluate the R code and appraise the outputs to demonstrate a satisfactory level of basic programming skills in R.
R is a programming language and an open-source software environment for statistical computing and graphics available for Windows, MacOS, and Linux operating systems (R Core Team, 2023). R is an interactive environment for data science that enables us to import, manipulate, model, and visualize data to effectively communicate our results (Wickham & Grolemund, 2017). The use of R also promotes transparency and open research, with a clear focus on supporting reproducibility policies (Gandrud, 2015).
R, in its most basic form, is composed by (1) a script in which we write the lines of R code that we run, and (2) the console that displays the results and debugging (Figure 2.1). If we generate a plot, it will emerge as a pop-up window, showing one plot at a time. For more details on what is R, click here.
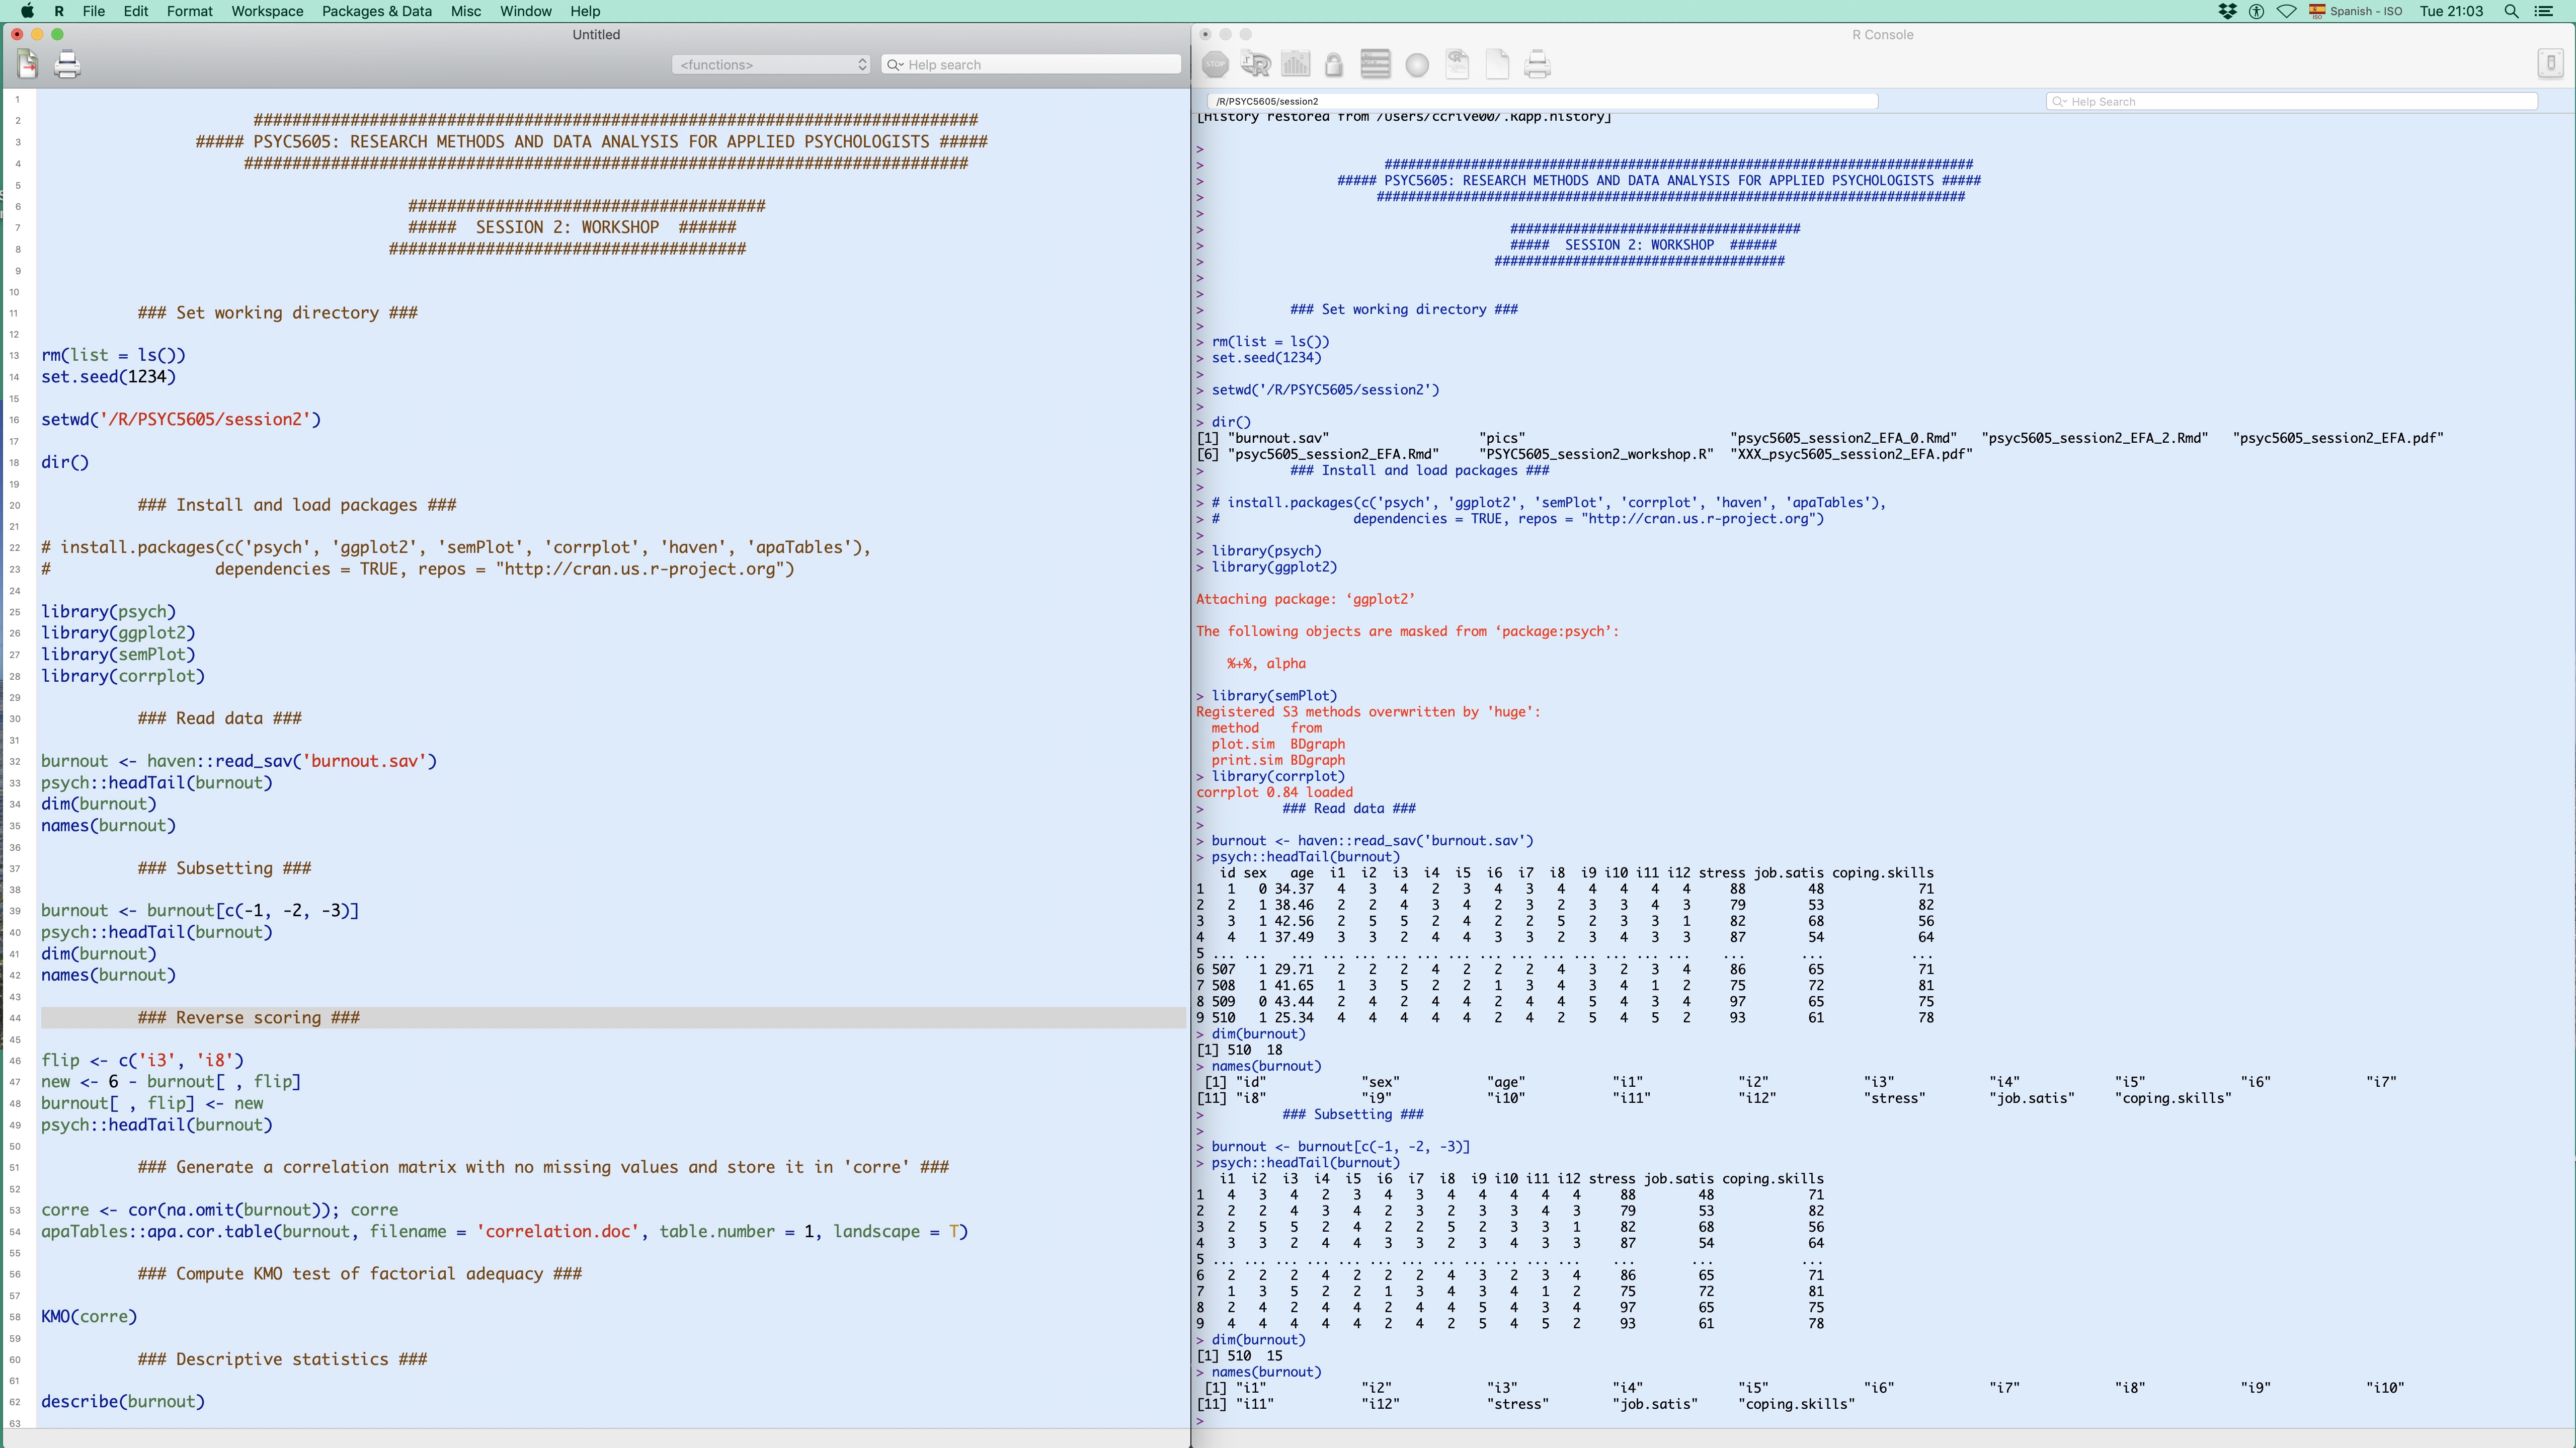
Figure 2.1: R displayed in two panels: Script (left) and Console (right).
Why Use R?
- It is a free and open-access programming environment for data science
- Reproducible and transparent research in psychological science
- Unlimited capabilities for data science (e.g., analysis, modelling, visualization)
- It is dynamic. R is constantly evolving. It provides state-of-the-art solutions for any imaginable field (e.g., economics, psychology, genetics, medicine, ecology, sociology, computational physics, geography, psychometrics)
- R has the biggest global community providing all sorts of free resources to support learners (e.g., reference manuals, books, on-line tutorials, R code and notebooks, cheat sheets, Internet forums)
- R is more efficient than any other commercial software
- UK universities teaching 21st century data science with R: University of Glasgow, Lancaster University, Nottingham Trent University, University of Edinburgh, University of Lincoln, University of Manchester, University of Plymouth, University of Sussex, Queen Mary University of London, University of Sheffield, University of Essex, Oxford University, King's College, University of Warwick...
- Employability