15.2 Item Characteristic Curve (ICC)
The probability of being correct on one item will be a monotonically increasing function of ability (\(\theta\)), whereas the probability of endorsing an attitude item (i.e., polytomous item) will be a single peaked function of the level of that attitude (Revelle, 2023).
The monotonically increasing function is called Item Characteristic Curve (ICC). It combines the proportion of correct responses in a given item (see \(P(\theta)\) in the y-axis) with the ability/trait level (see \(\theta\) in the x-axis).
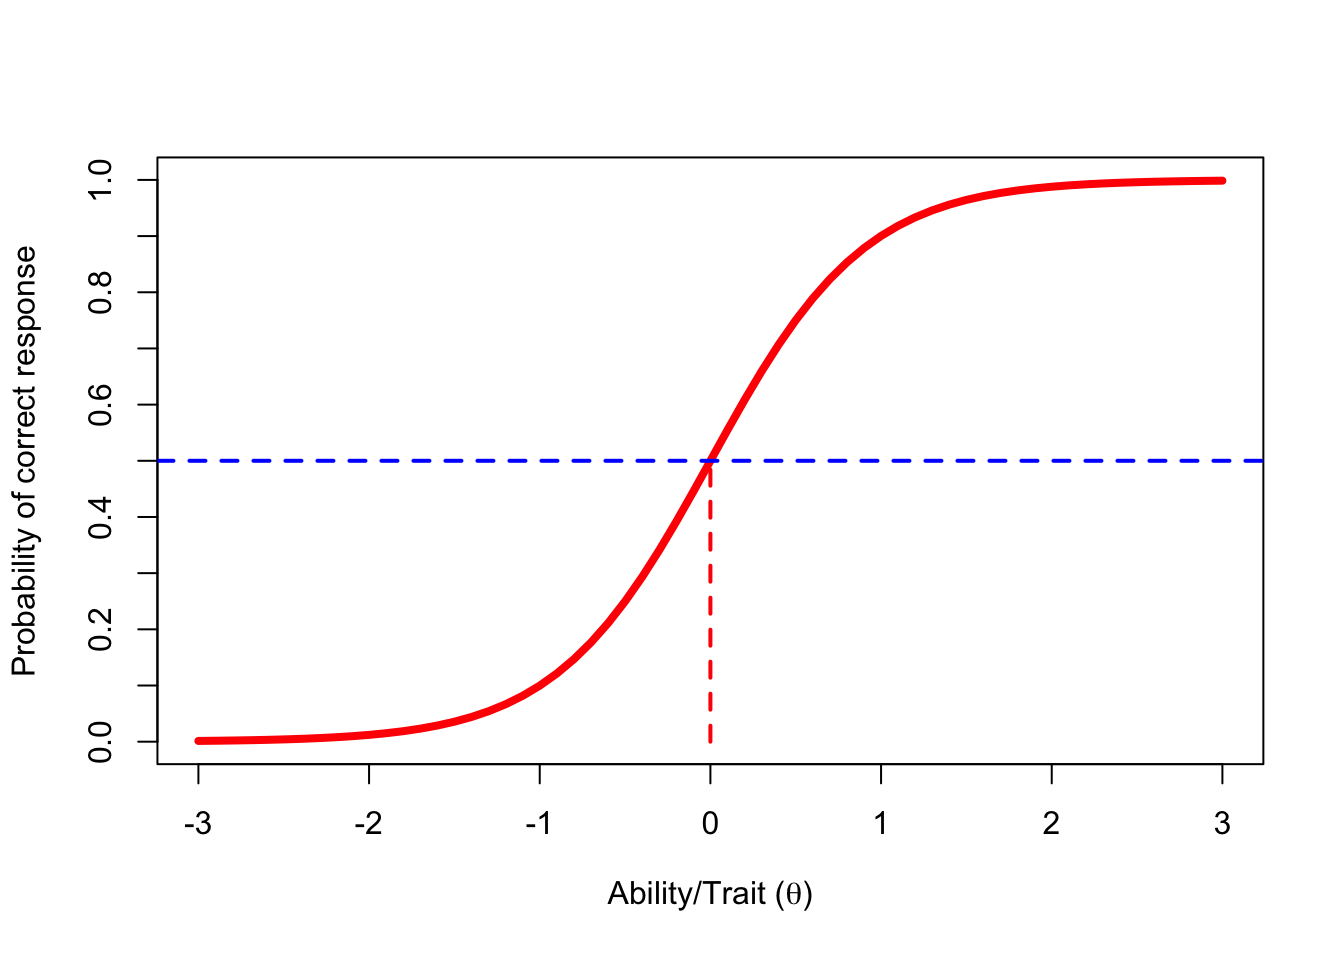
IRT's item statistics are the Item Characteristic Curve's parameters. These parameters depend on the IRT model being used. For example, a two-parameter logistic model (2PLM) will estimate the item's difficulty (\(b_{j}\)) and discrimination (\(a_{j}\)).
15.2.1 Example: Depression scores
Let's imagine that we want to estimate the level of depression of 30 respondents using one dichotomous item (i.e., I do not enjoy going out with my friends anymore). Respondents may agree or disagree with the statement of this item. We assume that respondents agreeing with the previous statement are experiencing a major depressive episode (Table 15.2).
| Respondent | Level of depression | Agreement with the item |
|---|---|---|
| 1 | 4 | 0 |
| 2 | 4 | 0 |
| 3 | 4 | 0 |
| 4 | 5 | 0 |
| 5 | 5 | 0 |
| 6 | 5 | 0 |
| 7 | 5 | 0 |
| 8 | 6 | 0 |
| 9 | 6 | 0 |
| 10 | 7 | 0 |
| 11 | 7 | 0 |
| 12 | 8 | 0 |
| 13 | 8 | 0 |
| 14 | 8 | 0 |
| 15 | 9 | 0 |
| 16 | 9 | 0 |
| 17 | 9 | 0 |
| 18 | 9 | 1 |
| 19 | 9 | 1 |
| 20 | 10 | 0 |
| 21 | 10 | 1 |
| 22 | 10 | 1 |
| 23 | 10 | 0 |
| 24 | 10 | 1 |
| 25 | 11 | 1 |
| 26 | 11 | 1 |
| 27 | 11 | 1 |
| 28 | 12 | 1 |
| 29 | 12 | 1 |
| 30 | 14 | 1 |
| Note. Item: I do not enjoy going out with my friends anymore. |
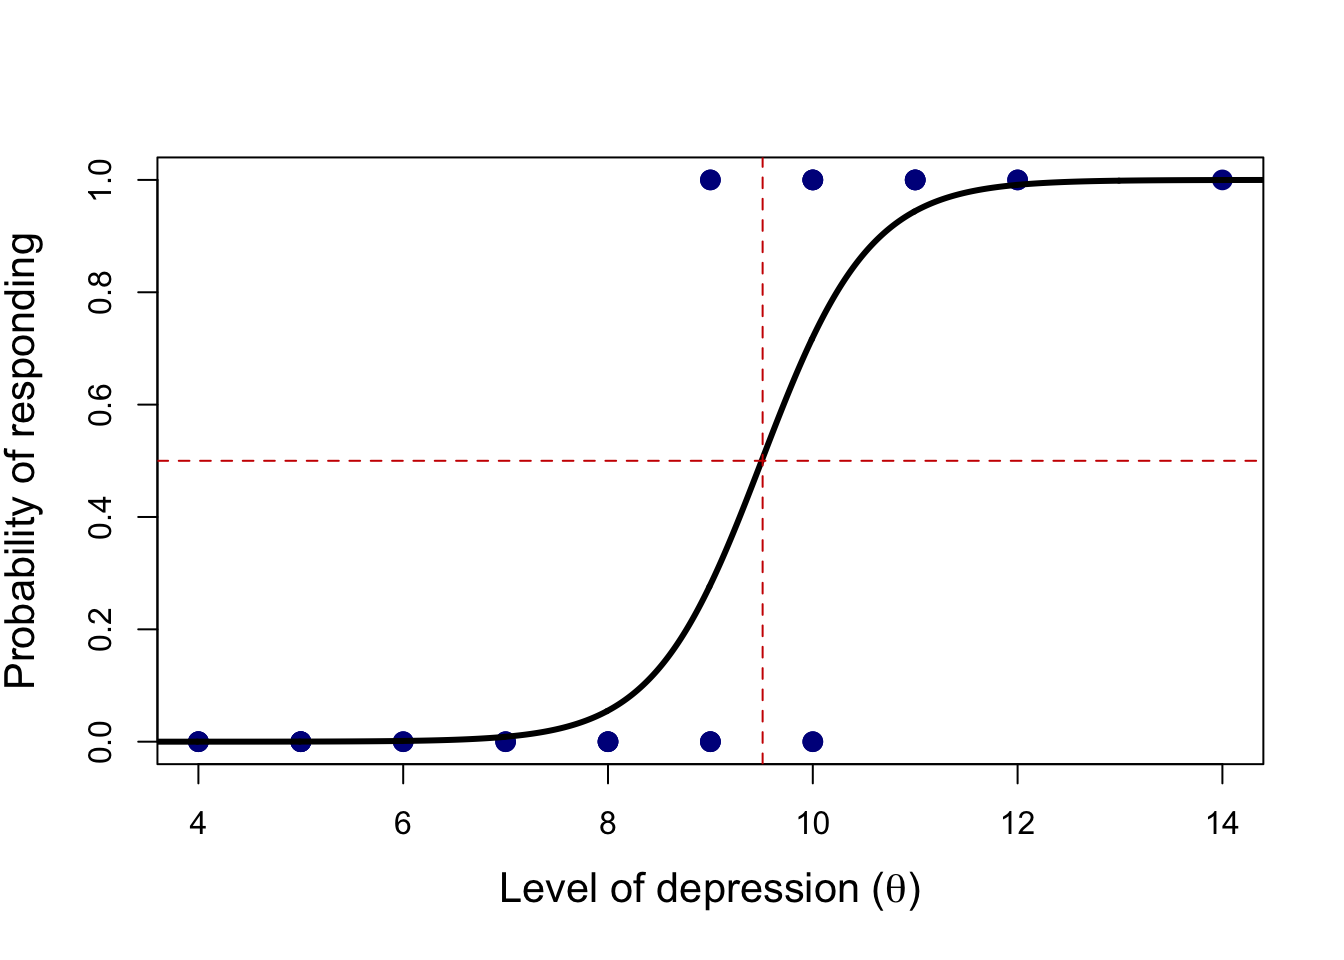
If we plot the values displayed in Table 15.2, we will find that a monotonic distribution represents the probability of respondents agreeing with the item "I do not enjoy going out with my friends anymore" given their level of depression. Figure 15.2 shows that there is a 50% chance of agreeing with the item at levels of depression close to 10 (\(\theta\) = 9.51).